EnergyPQA.com®
What’s New
- Discover New Innovations in EnergyPQA.com®
Ideal for Sustainability and GO Green Initiatives
W.A.G.E.S. Commodity Management and PUE for Data Centers
Release 6 – 3/15/23
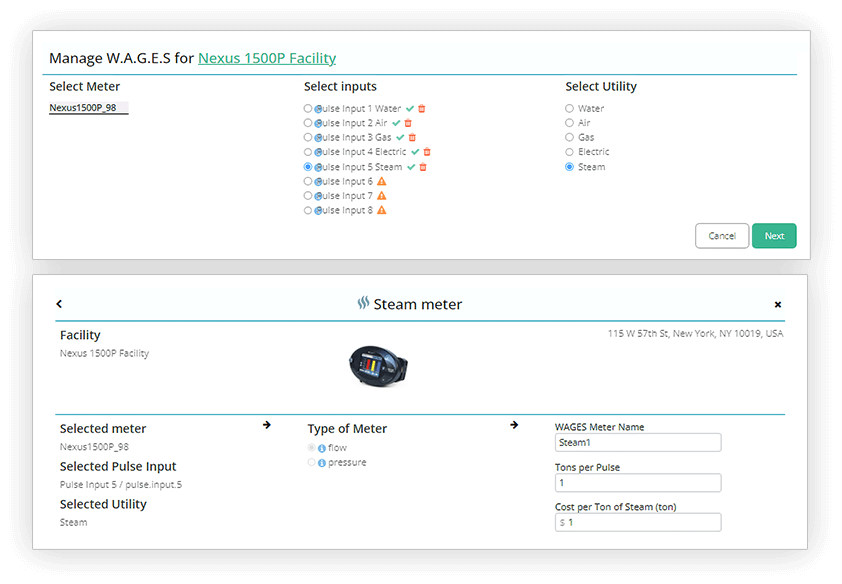
Water, Air Flow, Gas, Electric, and Steam (W.A.G.E.S.)
EnergyPQA® eliminates discrete systems for facility commodities’ usage. You can now analyze water, air flow, gas, electric, and steam (W.A.G.E.S.) usage from pulse or analog inputs of EIG meters.
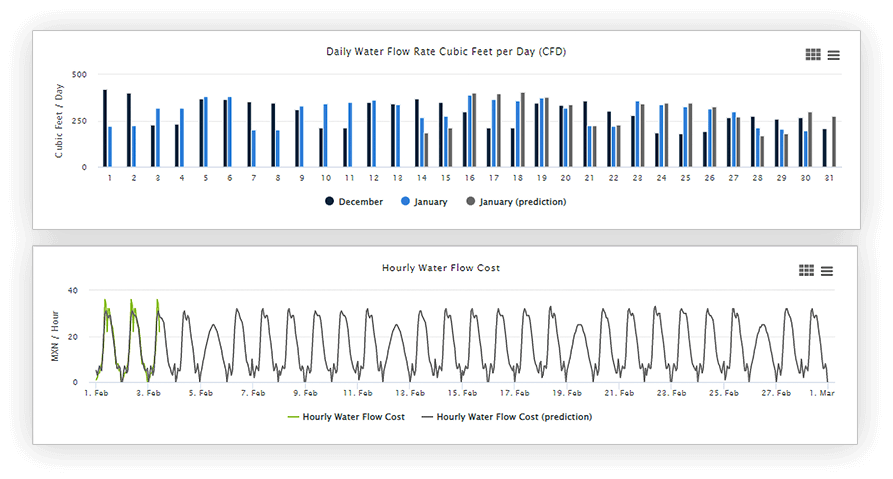
Predict commodity usage and costs through the end of the month.
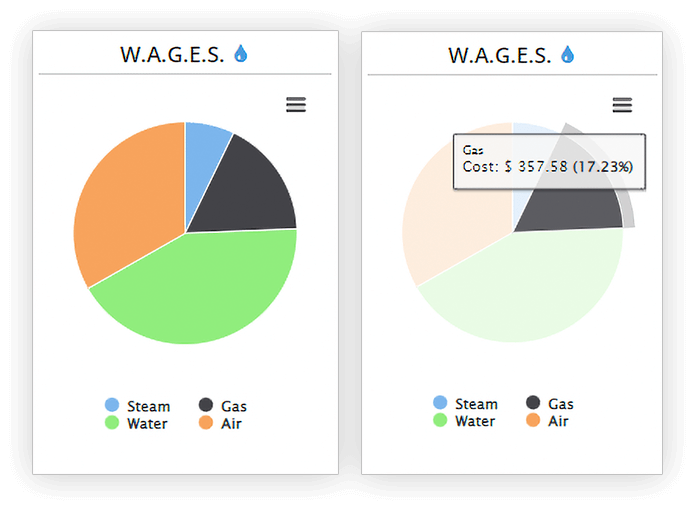
Disaggregate total commodity costs.
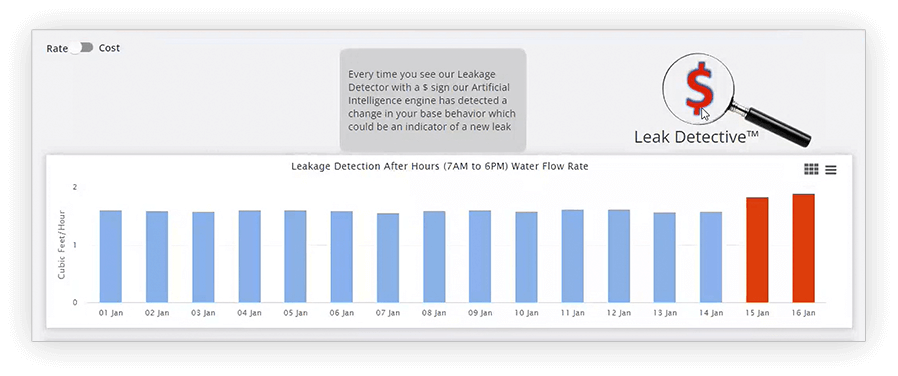
Use the EnergyPQA.com® system’s Leak Detective™ feature to discover facility leaks.
- Identify commodity waste and areas in need of repair.
- For water, higher than expected flow rate.
- For air, lower than usual air flow (for analog inputs only).
PUE for Data Centers
Data centers measure their power usage effectiveness (PUE) by dividing the overall power usage for the data center by the amount of power used to run IT equipment. The PUE number that results from this calculation lets them gauge how much of their energy spend is dedicated to computing, which generates income, and how much is dedicated to non-computing loads, such as cooling and infrastructure, which don’t generate income.

C-Suite Cost Management and Risk Mitigation Reporting, PQ Direction for Fault Location, Advanced Waveform Analysis, and Enhanced Enterprise Webpages
Release 5 – 1/20/22
C-Suite Cost Management Report Helps You Achieve Corporate Sustainability Goals
C-Suite Cost Management Report uses AI Analytics to determine which facilities and which circuits within those facilities are the most energy wasteful. This enables energy managers to meet their corporate targets for energy sustainability, carbon footprint reduction, and energy conservation by focusing on the facilities most in need of improvement first.


C-Suite Risk Mitigation Report Identifies and Quantifies Power Quality Events Within Your Enterprise
Risk Mitigation report uses AI analytics to grade and rank circuits from the most to least dangerous. Analytics are based on voltage conditions, current conditions, and harmonics. Using EnergyPQA®‘s Risk Mitigation tools, an energy manager can improve electrical reliability, increase safety, and optimize capital expenditure costs.
PQ Direction and Power Harmonic Direction Fault Detection
The version 5 release of the EnergyPQA® Al driven energy management system provides power quality direction and power harmonic direction.
- PQ direction determines locations of faults at critical circuits and provides an analysis identifying the faults as either upstream or downstream from the location of the meter.
- The system also analyzes power harmonics and determines whether the harmonics are present from the source (a power provider) or from the load.


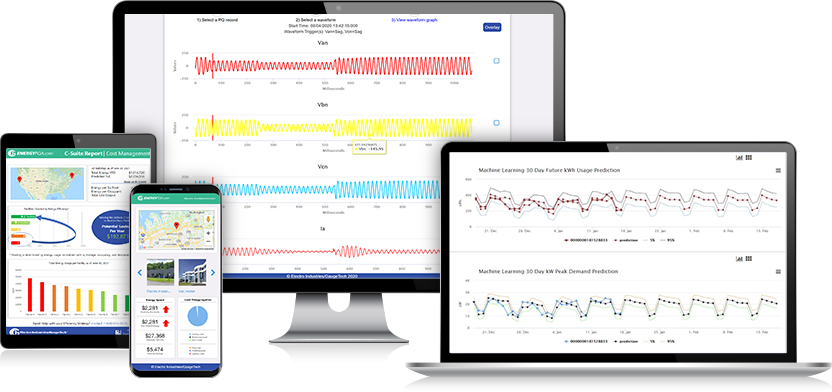
Advanced Waveform Analysis with Single Cycle and RMS Trending
EnergyPQA.com®‘s V5 release supports advanced waveform tools that allow users to not only view waveforms, but to conduct forensic engineering analysis to determine the exact cause of faults and improve power system reliability.
EnergyPQA.com®‘s waveform analysis now supports single phase and single cycle waveform display. It gives the user the ability to add time ranges and annotation comments to the waveform. Ranges and annotations are saved in the database so they can be shared with others and kept for a historical perspective.
The system also displays RMS values cycle by cycle, enabling the user to trend RMS.
Enhanced Facility and Enterprise Summary Webpages
EnergyPQA.com®‘s V5 release offers enhanced enterprise features that enable enterprise wide details and summaries of all facilities and their energy usage and power quality information. A new enterprise summary page displays enterprise summary and facility comparison information with colorful, easy-to-understand graphs and icons. The main enterprise Facilities screen has been redesigned and now displays facility information in an easy-to-view format.

Dual Factor Authentication, Load Disaggregation, and Degree Days Added to EnergyPQA.com® System
Release 4B – 4/27/21
Dual Factor Authentication
Dual (two) factor authentication has been added to further improve the system’s security. You must now enter a verification code, in addition to your username and password, to log on to the system. You will be prompted to set up cell phone or email notification of the code.


Load Disaggregation
Load disaggregation breaks out discrete energy loads within a facility, to identify inefficiencies and to proactively predict equipment failure within facility areas.
Degree Days
Degree days charts are useful for energy usage analysis and resource planning. In addition to energy usage, degree days consider a building’s heating or cooling needs based on the outside temperature. A degree day is calculated by comparing the day’s temperature to a temperature, e.g., 65 °F, that doesn’t require building heating or cooling. The degree days are shown in the chart along with the energy usage for that day. Predicted degree days are also shown for future dates, for instance from the current date through the end of the month.

Enterprise-level Reporting Provides Analysis for Your Complete Business
Release 4 – 2/8/21
Enterprise-level Reporting
With the EnergyPQA® Energy Management system, you can perform analysis of your energy usage enterprise wide. The EnergyPQA® Energy Management system’s enterprise level reporting lets you compare the following, for each of your facilities:
- Total energy usage.
- Energy used per square foot.
- Energy used per occupant.


You can view predicted energy usage through the end of the month and year and the usage change from the prior month and year, for your enterprise and for each facility. The EnergyPQA® Energy Management system’s enterprise comparison feature also lets you view the above graphs.
Calculate CO2 Footprint per Facility or Enterprise Wide
In addition, you can view CO2 footprint, which lets you analyze the carbon footprint per facility and for your total enterprise, measuring your impact on the environment.
- Total usage for the past five years, for energy, energy per square foot, energy per occupant, and CO2 footprint.
- Top ten facilities for usage and predicted usage through the end of the month.
- Enterprise usage comparison between current year and prior year, for each facility.