
Comprehensive Energy Management for Universities
Reduce Costs and Improve Power System Reliability
- Maximize Energy Usage Campus-wide
- Monitor Power Quality and Respond Quickly to Prevent Power Outages
- Reduce Energy Costs
- Interface with SCADA and Building Management Systems
- Use Predictive Analytics to Benchmark Campus Sustainability Initiatives
Introduction

Manage Energy Usage Campus-wide
Universities are large consumers of electricity. According to ENERGY STAR® (a U.S. government-backed program), educational facilities in the United States spend over $14 billion on energy each year. To manage their energy usage, many universities implement energy management software and/or SCADA applications. The backbone of energy management is accurate energy and power quality metering. This is because the ability to monitor energy usage and power quality is essential for ensuring an efficient and consistent supply of energy to all areas of a university campus.
EIG meters are certified to the highest energy accuracy standards. They provide advanced revenue metering capability coupled with power quality metering and analysis capabilities. They integrate seamlessly with EIG’s energy management and SCADA applications, and they feature standard communication protocols (Modbus, DNP3, BACnet, etc.) and multiple communication ports to interface with any existing SCADA or other applications your university is using.
Monitor Power Quality and Respond Quickly to Prevent Power Outages
University buildings, from labs and classrooms to student housing, depend on high quality electricity to keep the lights on and equipment performing properly. When there are power quality events, originating either at the utility or on the campus, quick action is needed to prevent problems from escalating to the point of power outage. EIG’s advanced power quality meters are certified to the highest international standards for power quality monitoring. They enable campus facility managers to measure all power quality indices and to be alerted to any power quality problems in the system. The meters give facility managers the ability to program limits on power quality parameters, e.g., a drop in voltage (a voltage sag). When these limits are exceeded, the meters can send emails to multiple parties, alerting them to the problem. This allows campus facility operators to respond immediately, e.g., activating backup sources, so that the power does not go out.

Reduce Energy Costs
Lowering energy costs is also essential for universities today. No one can afford to waste energy, and universities, as large consumers of electricity, are no exception. EIG meters and energy metering software contribute to lower energy costs in multiple ways.
Submetering
One of the ways that submeters help to reduce costs is through properly allocating energy usage and establishing accountability for that usage with the energy consumer. When a university department is made aware of how much energy they are using and are billed accordingly, they are motivated to reduce their usage. Also, when metering data shows that an area is using more energy than expected, facility managers can investigate the causes and make corrections. As a simple example, if laboratory areas are lit at night even when not consistently or fully in use, automatic lighting can supply electricity just to the areas that are being used at the time.
Peak Demand
One of the ways that universities can lower their energy costs is through managing their peak power usage. Since utilities often apply a surcharge during periods of peak demand, being able to switch to generator power or to lower demand at those times will significantly reduce energy costs. The EnergyPQA.com® system can predict peak demand usage up to three days in advance. This gives facility operators time to manage the usage and avoid the peak demand penalty.
Increased Energy Efficiency
Power quality meters can monitor and send email alarm on power factor, harmonics, surges/sags, and other power quality indices. These problems can not only lead to power outages, they can also cause reduced energy efficiency, which has an impact on energy costs. When energy efficiency is low, more energy is needed to do its job. Increasing energy efficiency will lower usage and costs.
Also, by monitoring important university equipment, power quality data can indicate when the equipment is using more than expected amounts of energy, which can indicate the need for maintenance. By repairing the equipment when problems are first seen, the university avoids the expense of replacing expensive equipment.

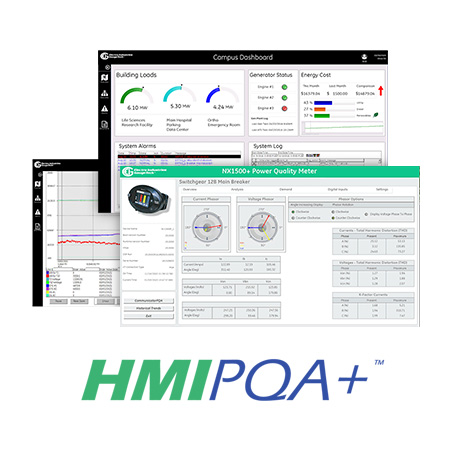
HMIPQA+™ SCADA Solution’s Real Time and Historical Trending Dashboard Examples
Interface With SCADA and Building Management Systems
If your university is already using a SCADA application for energy management, EIG meters can be seamlessly integrated into the existing system. As mentioned before, EIG meters are equipped with multiple communication ports and support multiple protocols. If your university has not yet implemented a SCADA system, EIG’s HMIPQA+™ is a SCADA solution that gives facility operators real time data on all areas of the university’s energy infrastructure. You can use the HMIPQA+™ SCADA solution to:
- View real time usage in a centralized location to gain control over all aspects of the university’s energy use and power quality.
- Perform customized reporting of critical energy management and power quality issues.
- Perform detailed root-cause analysis of downtime events.
- Log historical data for trend analysis and capacity planning.
- Identify inefficiencies and prioritize areas for energy savings opportunities.
- Analyze historical trends to help predict potential issues.
If the university is using a Building Management System (BMS), EIG offers both meters and communication converters to send metering data to BACnet or other BMS applications.
Use Predictive Analytics to Benchmark Campus Sustainability Initiatives
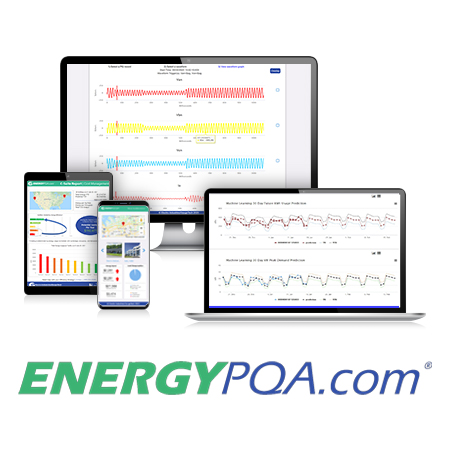
Many universities are at the forefront of energy sustainability. Measuring the success of sustainability initiatives as early in the process as possible saves time and resources. It also leads to greater success. Since the EnergyPQA.com® energy management system’s AI driven machine learning predicts energy usage and demand into the future, implement energy saving programs and then use the system’s prediction data and graphs to ascertain if sustainability plans are going to be successful. Make changes as needed and reassess the predicted outcomes. Additionally, use the EnergyPQA.com® energy management system to evaluate the university’s carbon footprint with predictions to the end of the month and year.

Compare Campus Facilities’ Carbon Footprint
Typical University Building Layout

Products
University Products
Nexus® 1500+ meter | |
|---|---|
 | Power Quality AnalyzerExample Installation: Utility Entry Points, Critical Loads, High Power Sensitivity Points |
Shark® 250 meter | |
|---|---|
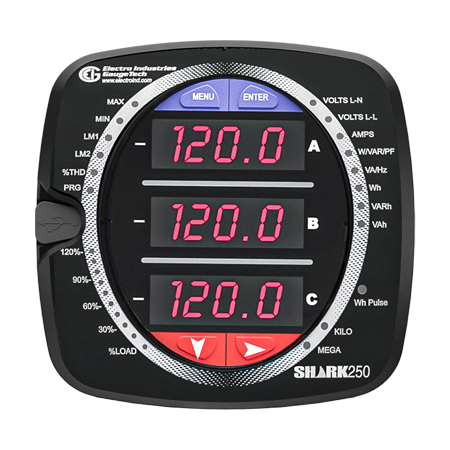 | Cyber Secure Power and Energy MeterExample Installation: Typical Building Loads, Substations, Control Panels |
Shark® 100B meter | |
|---|---|
 | Power and Energy Meter with Native BACnet/IPExample Installation: To fit an existing BACnet application |
MP200™ multipoint metering system | |
|---|---|
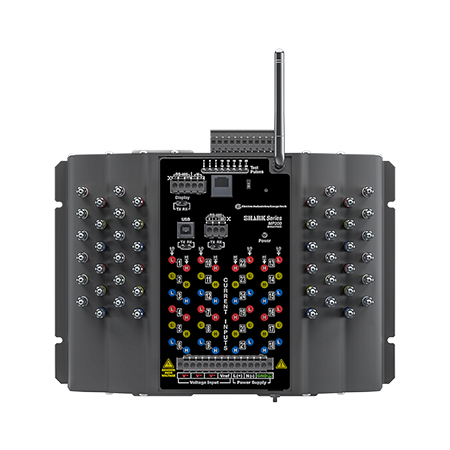 | 8 Three Phase InputsExample Installation: Smaller Panel Boards, High-density Circuits, Administration Offices, Dormitories |
HMIPQA+™ Next Generation SCADA Solution | |
|---|---|
 | Simple, scalable, fully customizable application with open connectivity and multi-protocol supportOrdering Part #: Contact EIG_sales@hubbell.com. |
EnergyPQA.com® AI Driven Energy Management System | |
|---|---|
 | Provides energy analytics and predictions, reducing costs and improving power system reliabilityOrdering Part #: ENERGYPQA-1Y |
Downloads

https://www.electroind.com/eigs-energypqa-com-cloud-solution-is-finalist-in-plant-engineerings-2020-product-of-the-year/
https://www.electroind.com/eig-releases-energypqa-com-cloud-based-energy-management-solution/
https://www.electroind.com/facts-you-should-know-about-commercial-energy-waste-in-2019/
https://www.youtube.com/watch?v=XTiIsF1D0Fc
https://www.youtube.com/watch?v=GAVJERWMKeU