-
CommunicatorPQA™
Software Application 5
- Comprehensive Charting, Graphing & Analysis for Power Information
- View Waveform Records with Comprehensive Data Analysis Features
- Monitor Power Reliability
- Perform Power Quality Analysis
- Improve System Uptime
- ODBC Databases for All Collected Data
- Programming and Configuration
CommunicatorPQA™
Software Application 5
CommunicatorPQA™
Software Application 5
- Comprehensive Charting, Graphing & Analysis for Power Information
- View Waveform Records with Comprehensive Data Analysis Features
- Monitor Power Reliability
- Perform Power Quality Analysis
- Improve System Uptime
- ODBC Databases for All Collected Data
- Programming and Configuration
- Comprehensive Charting, Graphing & Analysis for Power Information
- View Waveform Records with Comprehensive Data Analysis Features
- Monitor Power Reliability
- Perform Power Quality Analysis
- Improve System Uptime
- ODBC Databases for All Collected Data
- Programming and Configuration
CommunicatorPQA™
Software Application 5
- Comprehensive Charting, Graphing & Analysis for Power Information
- View Waveform Records with Comprehensive Data Analysis Features
- Monitor Power Reliability
- Perform Power Quality Analysis
- Improve System Uptime
- ODBC Databases for All Collected Data
- Programming and Configuration
-
ODBC Databases for All Collected Data
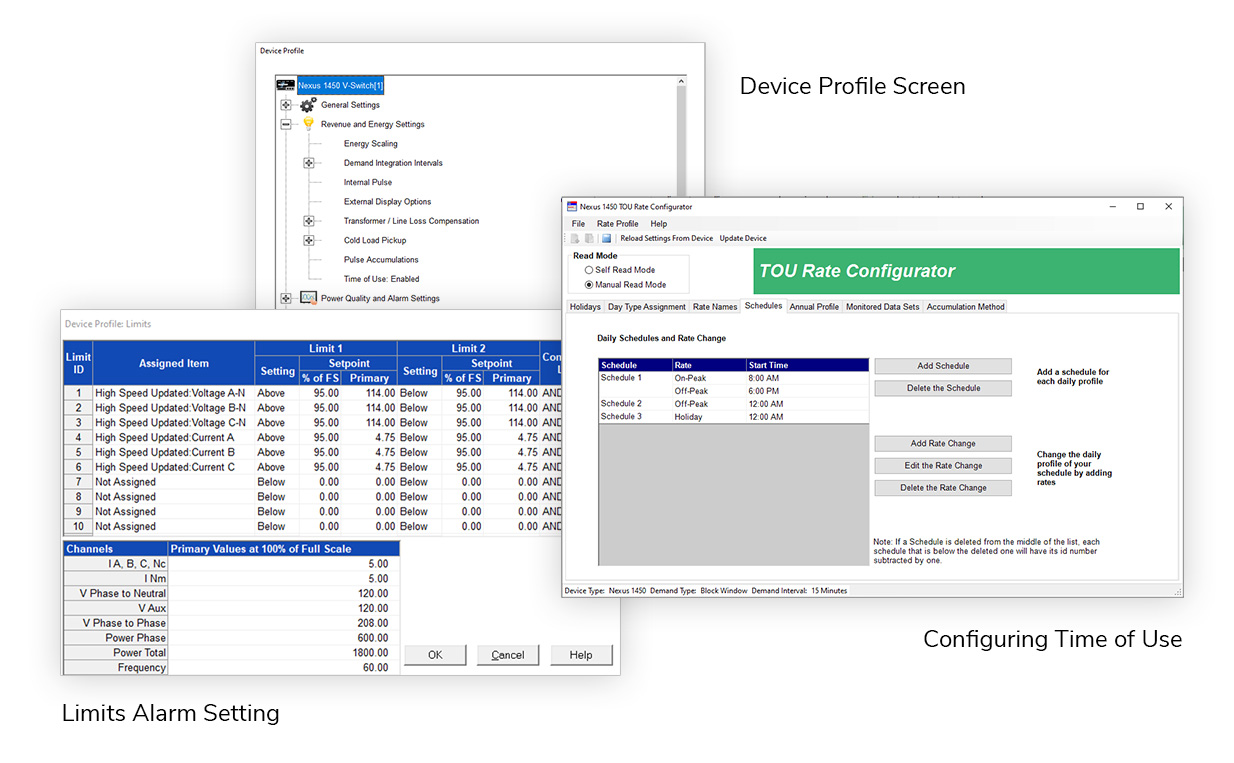
In today’s information age, collecting data is simple. Managing data is the task at hand. The CommunicatorPQA™ application uses an ODBC database structure. ODBC structure means that the data is easily accessible by most other 3rd party applications. This allows data to be managed as well as collected. The database automatically configures itself so that you do not have to be versed in database knowledge to maintain the data.
Programming & Configuration
The CommunicatorPQA™ application also allows users to program, configure and optimize metering systems to meet the exact application needed. Unlike most other systems, the CommunicatorPQA™ application was painstakingly designed to make programming and configuration simple and easy to use. This takes much of the guesswork out of configuring a meter and gets the system up and running simply and quickly.
ODBC Databases for All Collected Data
Programming & Configuration
The CommunicatorPQA™ application also allows users to program, configure and optimize metering systems to meet the exact application needed. Unlike most other systems, the CommunicatorPQA™ application was painstakingly designed to make programming and configuration simple and easy to use. This takes much of the guesswork out of configuring a meter and gets the system up and running simply and quickly.
-
CommunicatorPQA
™ PQ Charting and Graphing
Advanced Power Quality Charting and Graphing
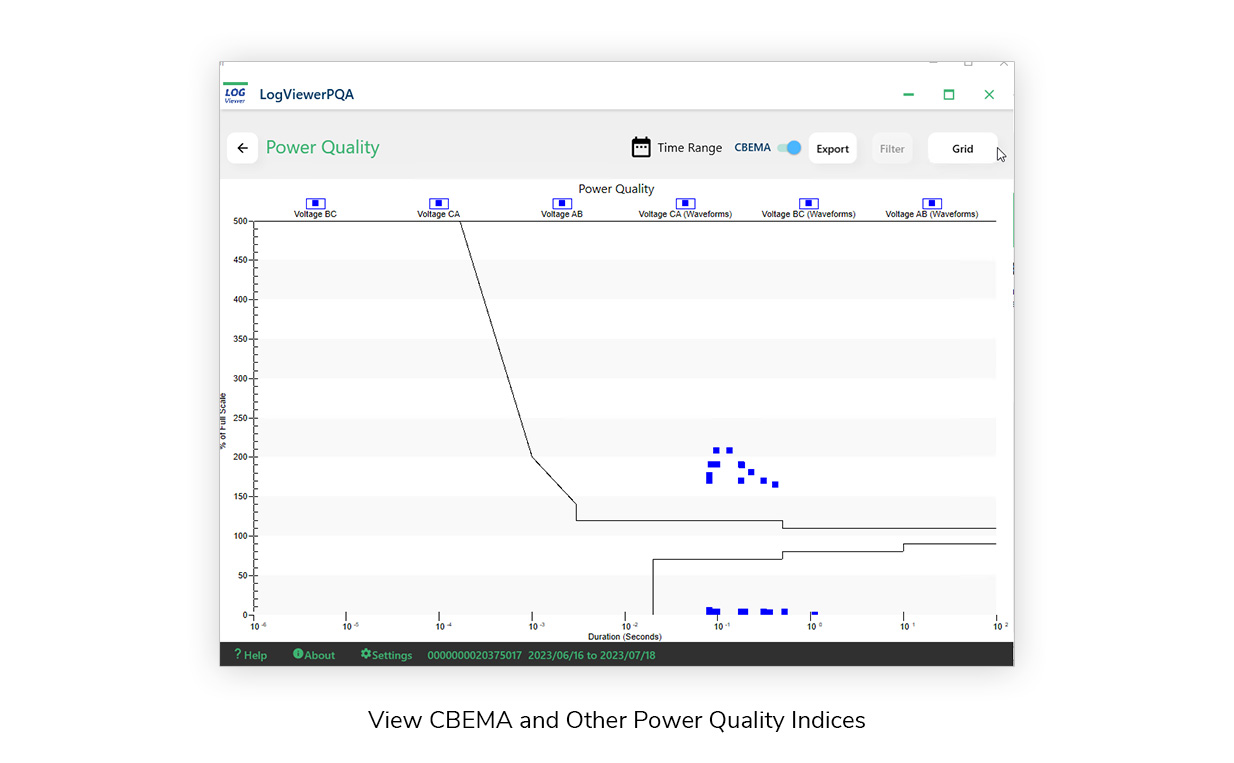
The CommunicatorPQA™ application lets you calculate power quality on a scatter graph, giving you CBEMA plotting information. The CBEMA plot gives definition to the severity of events and their effect on equipment, since events that fall outside the CBEMA tolerances may be damaging the monitored equipment. The software provides 3D plots and histograms with frequency and severity of PQ events.
CommunicatorPQA™ PQ Charting
and Graphing
CommunicatorPQA™
PQ Charting and Graphing
The CommunicatorPQA™ application lets you calculate power quality on a scatter graph, giving you CBEMA plotting information. The CBEMA plot gives definition to the severity of events and their effect on equipment, since events that fall outside the CBEMA tolerances may be damaging the monitored equipment. The software provides 3D plots and histograms with frequency and severity of PQ events.
CommunicatorPQA™ PQ Charting and Graphing
The CommunicatorPQA™ application lets you calculate power quality on a scatter graph, giving you CBEMA plotting information. The CBEMA plot gives definition to the severity of events and their effect on equipment, since events that fall outside the CBEMA tolerances may be damaging the monitored equipment. The software provides 3D plots and histograms with frequency and severity of PQ events.
Advanced Power Quality Charting and Graphing
-
CommunicatorPQA™
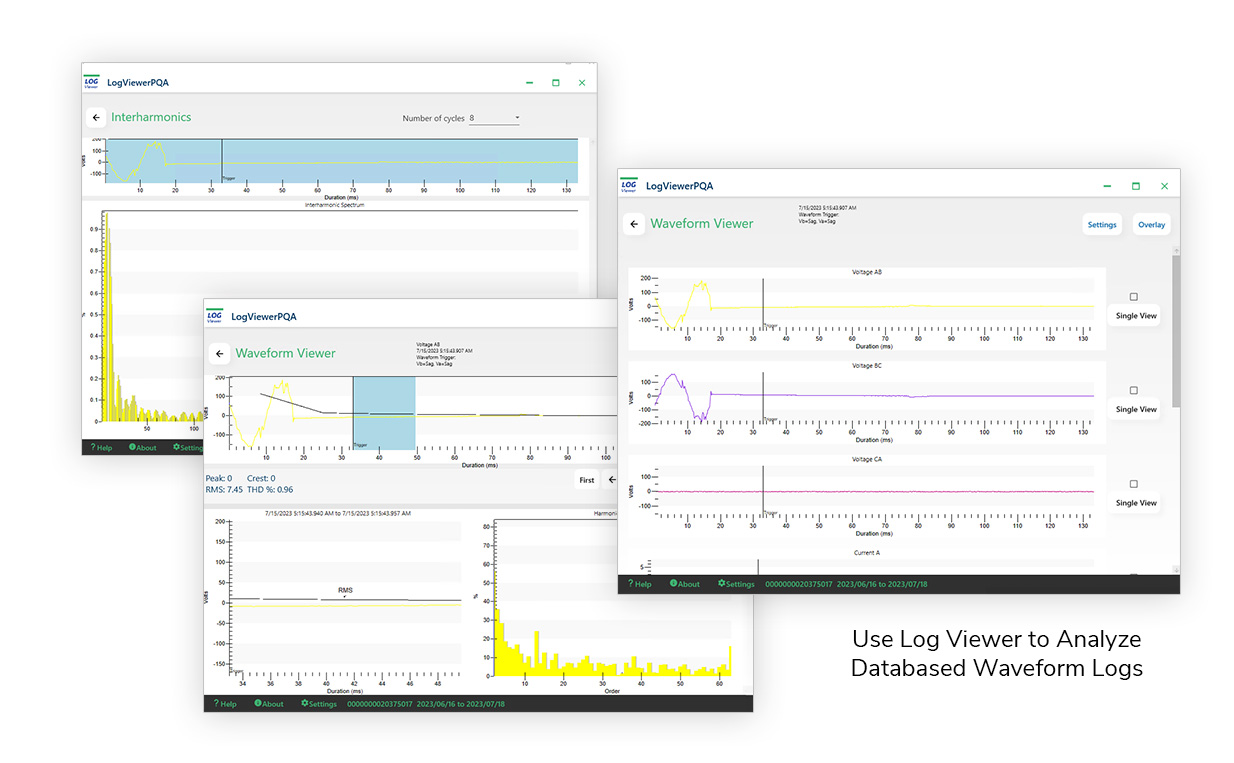
View Waveform Records with Comprehensive Data Analysis Features
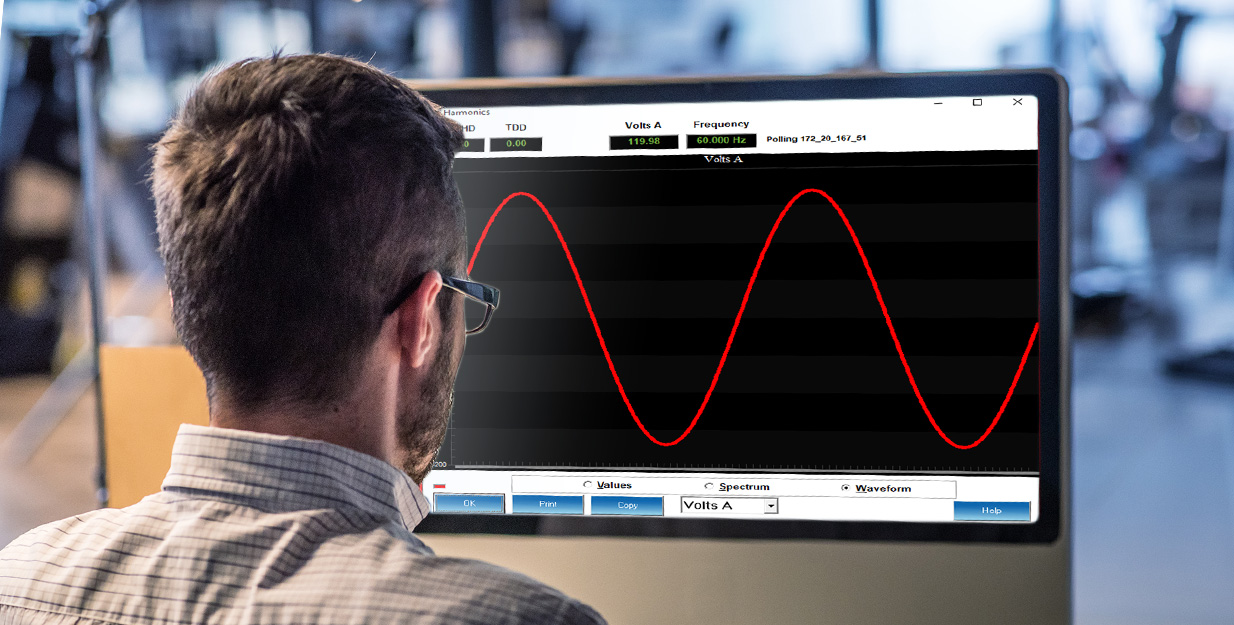
View stored waveforms of events caused by power quality problems, faults, transients and many other conditions. Using the Communicator PQA™ software, you can:
- View & superimpose multiple waveforms
- Zoom & pan events
- Place hash marks directly on waveform graphs to calculate delta time & differing event durations
- Conduct harmonic analysis on waveform data using harmonic magnitudes, peak value and RMS readings per cycle
CommunicatorPQA™
View Waveform Records with
Comprehensive Data Analysis Features
Communicator EXT™
View Waveform Records with
Comprehensive Data Analysis
Features
View stored waveforms of events caused by power quality problems, faults, transients and many other conditions. Using the CommunicatorPQA™ software, you can:
- View & superimpose multiple waveforms
- Zoom & pan events
- Place hash marks directly on waveform graphs to calculate delta time & differing event durations
- Conduct harmonic analysis on waveform data using harmonic magnitudes, peak value and RMS readings per cycle
CommunicatorPQA™ View Waveform Records
with Comprehensive Data Analysis Features
View stored waveforms of events caused by power quality problems, faults, transients and many other conditions. Using the CommunicatorPQA™ software, you can:
- View & superimpose multiple waveforms
- Zoom & pan events
- Place hash marks directly on waveform graphs to calculate delta time & differing event durations
- Conduct harmonic analysis on waveform data
using harmonic magnitudes, peak value and
RMS readings per cycle
-
CommunicatorPQA™
Advanced Communication Structure
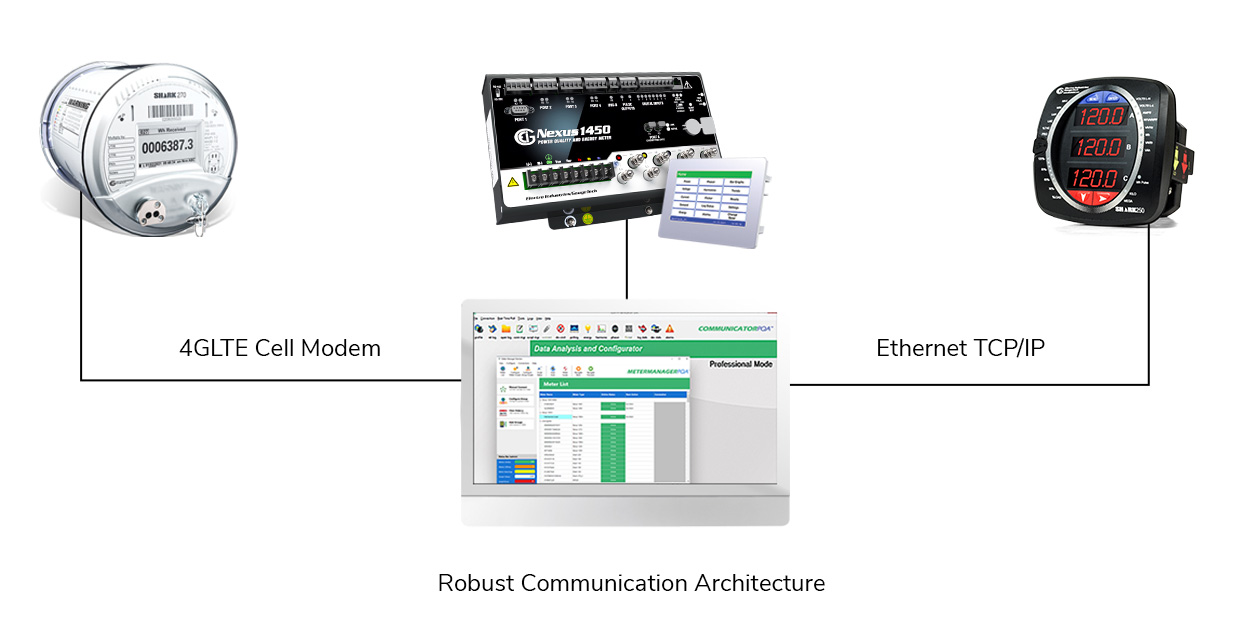
The CommunicatorPQA™ application allows users to access remote meters through three different methods. These include:
- Ethernet TCP/IP Modem
- Remote Modem (Dial-up or Wireless)
- Direct Serial Connection
These methods are interchangeable, so that a system can consist of multiple paths back to a main computer.
CommunicatorPQA™
Advanced Communication Structure
CommunicatorPQA™Advanced
Communication Structure
The CommunicatorPQA™ application allows users to access remote meters through three different methods. These include:
- Ethernet TCP/IP Modem
- Remote Modem (Dial-up or Wireless)
- Direct Serial Connection
These methods are interchangeable, so that a system can consist of multiple paths back to a main computer.
CommunicatorPQA™
Advanced Communication Structure
The CommunicatorPQA™ application allows users to access remote meters through three different methods. These include:
- Ethernet TCP/IP Modem
- Remote Modem (Dial-up or Wireless)
- Direct Serial Connection
These methods are interchangeable, so that a system can consist of multiple paths back to a main computer.
Ethernet
Modem
Serial
Ethernet
Modem
Serial
Ethernet
Modem
Serial
Ethernet
Modem
Serial
-
CommunicatorPQA™
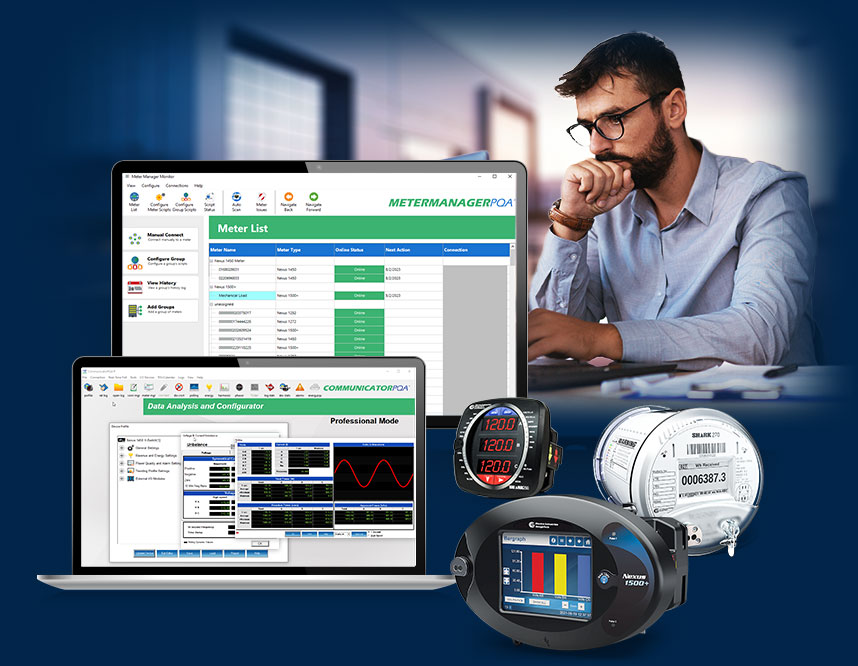
Advanced Real Time Viewing Capabilities
The CommunicatorPQA™ application displays real time data from EIG power monitors. The data is presented in a simple and powerful graphical format for easy access to information. The software provides many screens, including:
- Voltage, Current, Power & Energy
- Time of Use & Accumulations
- Power Quality
- Actual Real Time Waveforrn Scopes
- Alarms & Lints
- Max. & Min. for Each Parameter
- Power Quality
- I/0 Device Information
CommunicatorPQA™
Advanced Real Time Viewing Capabilities
CommunicatorPQA™ Advanced
Real Time Viewing Capabilities
The CommunicatorPQA™ application displays real time data from EIG power monitors. The data is presented in a simple and powerful graphical format for easy access to information. The software provides many screens, including:
- Voltage, Current, Power & Energy
- Time of Use & Accumulations
- Power Quality
- Actual Real Time Waveforrn Scopes
- Alarms & Lints
- Max. & Min. for Each Parameter
- Power Quality
- I/0 Device Information
The CommunicatorPQA™ application allows users to access remote meters through three different methods. These include:
- Ethenet TCP/IP Modem
- Remote Modem (Dial-up or Wireless)
- Direct Serial Connection
These methods are interchangeable, so that a system can consist of multiple paths back to a main computer.
CommunicatorPQA™
Advanced Real Time Viewing Capabilities
The CommunicatorPQA™ application displays real time data from EIG power monitors. The data is presented in a simple and powerful graphical format for easy access to information. The software provides many screens, including:
- Voltage, Current, Power & Energy
- Time of Use & Accumulations
- Power Quality
- Actual Real Time Waveforrn Scopes
- Alarms & Lints
- Max. & Min. for Each Parameter
- Power Quality
- I/0 Device Information