CommunicatorPQA®
Power Monitoring Software
- Program, Manage, Database, and View Logged Data
- View Real Time Data
- Perform Detailed Power Quality Analysis
- Quickly Configure Meters
CommunicatorPQA®
Power Monitoring Software
- Program, Manage, Database, and View Logged Data
- View Real Time Data
- Perform Detailed Power Quality Analysis
- Quickly Configure Meters
Advanced Real Time Viewing

Introduction
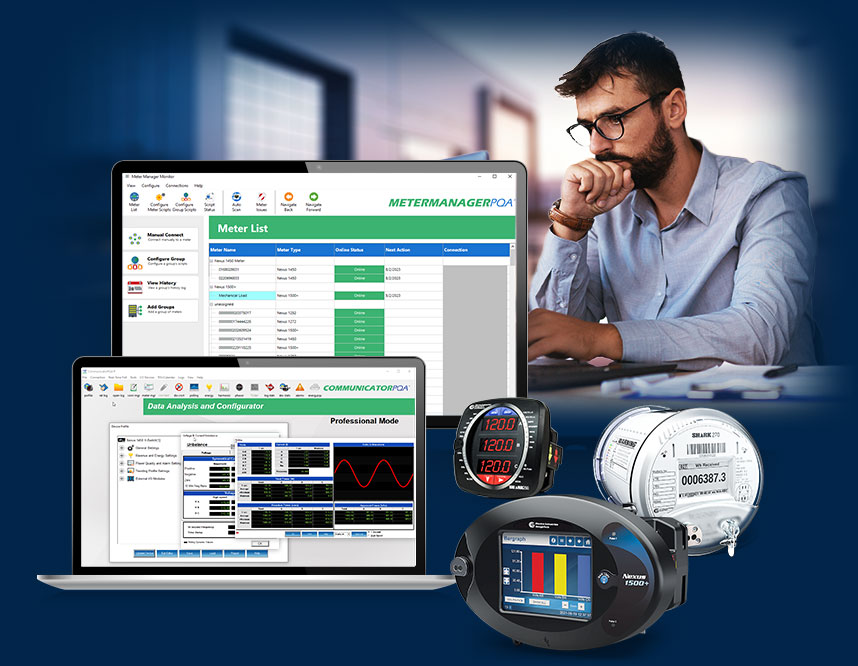
The CommunicatorPQA® power monitoring software enables users to view real time metered data, configure meters, and analyze collected information from remote EIG power monitors. This software provides superior screen visualization, graphing, and reporting functions for quick access to metering data and easy database archiving. The stored metering information is available for automatic integration into any 3rd party package.
Advanced Real Time Viewing
View Real Time Data from EIG Power Monitors
- View voltage, current, power, and energy.
- View Time of Use and accumulations.
- View power quality, including harmonic magnitudes, real time waveform scopes, and limit alarms.
- View max and min for each parameter.
- View I/O device information.

View Real Time Waveform Scope

Advanced Communication Structure
Access Remote Meters Through Multiple Communication Methods
- Supports serial, wired Ethernet, WiFi, and cellular modem communication.
- Supported protocols include Modbus ASCII, RTU, TCP/IP.
- Communication methods are simultaneous and interchangeable.
- Provides multiple paths back to a main computer.
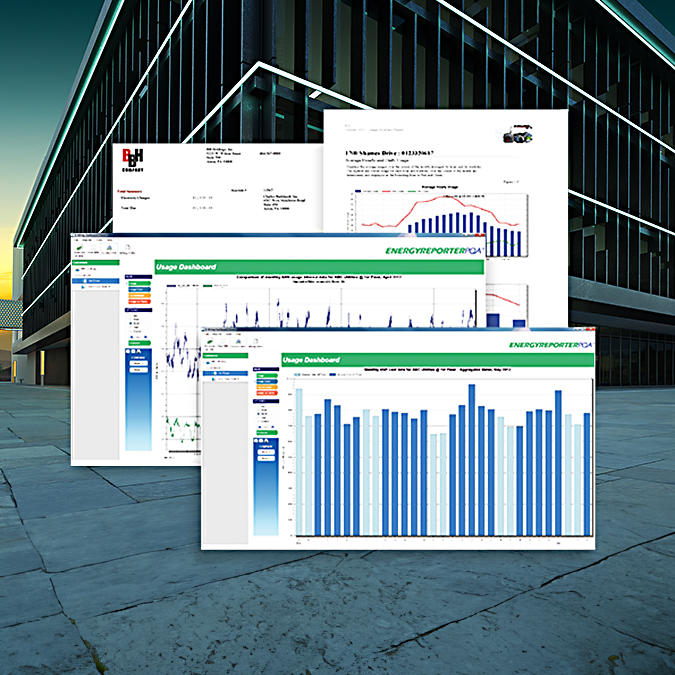
LogViewerPQA

LogViewerPQA Main Menu
LogViewerPQA
Charting and Graphing Application Included with CommunicatorPQA® Software
- Database driven application.
- Normalizes data from any EIG meter and displays in a concise easy-to-understand presentation.
- Charting and graphing functions allow easy access to data for fast and simple analysis.
- Tabular data format with direct spreadsheet application compliance.
Advanced Power Quality Charting and Graphing

Advanced Power Quality Charting and Graphing
- View ITIC, CBEMA, Semi F47, and other industry-standard graphs.
- Time waveform events using microsecond resolution.
- Power monitoring software compares circuits to each other.
- Review impact of changes to protective equipment and monitor and analyze circuit breaker performance.
- Conduct forensic analysis of catastrophic events.
View Waveform Records with Comprehensive Data Analysis Features
- View stored waveforms of events caused by power quality problems, faults, transients, and many other conditions.
- Superimpose multiple waveforms from one or more events in the power monitoring software.
- Zoom and pan events; place hash marks directly on waveform graphs to calculate delta time and event duration.
- Conduct harmonic analysis of waveform data using harmonic magnitudes, peak value, and RMS readings per cycle.
- All waveform faults are databased system-wide for power quality evaluation.

Programming and Configuration

Programming and Configuration
Program, Configure, and Optimize Metering Systems to Meet Application Needs
- Easy to use, intuitive configuration screens.
- Consistent metering setup across multiple metering systems eliminates guesswork.
- System up and running quickly and easily.
- The power monitoring software’s role-based authorization protects meter configuration.
The CommunicatorPQA® power monitoring software is available in a Lite mode and professional mode. The Lite mode allows users to configure meters, send setting files, download logs from stored meter memory, and provide data analysis of the power system. The professional version adds MeterManagerPQA® software and additional file converters like HHF, PQDIF, and COMTRADE file formats.
| Capability | CommunicatorPQA® Lite | CommunicatorPQA® Pro | EnergyPQA.com® System |
|---|---|---|---|
| Configure and program any EIG meter | ✓ | ✓ | ✓ |
| Store information in a database for SQL searches and data mining | ✓ | ✓ | ✓ |
| View basic charts and graphs | ✓ | ✓ | ✓ |
| Use basic power quality waveform viewer | ✓ | ✓ | ✓ |
| Auto find and group all meters on a network | ✓ | ✓ | |
| Auto collect data using MeterManagerPQA® automation server tools | ✓ | ✓ | |
| Create spreadsheet reports emailed automatically on a set schedule | ✓ | ✓ | |
| Generate PQDIF, COMTRADE, and HHF files automatically | ✓ | ✓ | |
| Access EnergyReporterPQATM billing application | ✓ | ||
| Organize meters into locations/facilities | ✓ | ||
| Access enterprise energy management | ✓ | ||
| Use artificial intelligence to forecast usage, demand, and many other energy management calculations | ✓ | ||
| View daily, weekly, and monthly usage comparisons for meters and facilities | ✓ | ||
| Access enterprise power quality recording analytics | ✓ | ||
| View heat map with predictions | ✓ | ||
| View load disaggregation | ✓ | ||
| View degree days | ✓ | ||
| Analyze energy use intensity including energy per square foot, per occupant, and others | ✓ | ||
| View carbon footprint analysis | ✓ | ||
| Program emails for alarm events, reports, and predicted demand | ✓ | ||
| Receive C-Suite reporting for actionable energy conservation | ✓ | ||
| Receive C-Suite reporting for actionable risk mitigation | ✓ | ||
| View water, air, gas, electric, and steam reporting | ✓ |
Downloads
Downloads
Product Brochure
Generic Specifications